
The efficacy of the proposed EMS in decreasing daily operational costs is investigated in this section.
Day‑ahead scheduling (level I) results
The generating units of the NGs are scheduled based on the weather, price, and load demand forecasts for the coming day.
Day‑ahead forecasting
For LR, SVM, and ANN-based forecasting, the RMSE are 8.86 W/m2, 6.86 W/m2, and 3.70 W/m2, respectively. The MAPEs for load, grid tariff, and wind speed forecasting using linear regression are 4.01%, 4.64%, and 6.86%, respectively. In contrast, the MAPEs for load, grid tariff, and wind speed forecasting using SVM-based methods are 1.82%, 3.18%, and 6.21%, respectively. However, the MAPEs for load, grid tariff, and wind speed forecasting using ANN-based methods are 0.90%, 1.60%, and 4.56%, respectively. As seen in Fig. 7, ANN offers lower predictive error for load, grid tariff, solar irradiation, and wind speed than SVM and conventional LR methods. As indicated in Table 2, it can be said that, when MAPE and RMSE are considered, LR-based and SVM-based methods are less accurate than ANN-based short-term forecasting.
Fig. 7
Forecast error for solar irradiance, wind speed, demand load, and grid price.
Table 2 Comparing the effectiveness of short-term forecasting techniques.Day‑ahead scheduling of generation units
The predicted loads, surrounding air temperature, solar intensity, wind speed, and grid price for Zaafarana City, Egypt, for the upcoming day are shown in Fig. 8. To assess the GOA technique operational costs and user comfort, various cases are compared with those of PSO, HHO, and DOA algorithms.
Fig. 8
Forecasting data of grid tariff, load, wind speed, and solar irradiance.
(a)
Scenario I: individual operation of NGs
In this study, each NG works independently from the adjacent grids. NG1 and NG3 have typical configurations, as do NG2 and NG4. This study uses four metaheuristic techniques to obtain the operating points of the diesel generator and the battery.
For NG1, the total operating cost per day calculated by GOA is approximately $64.55, whereas DOA reports $65.37, HHO shows $66.37, and PSO indicates $66.43 without applying DSM. To minimize daily operating costs, a DSM technique known as load shifting is utilized. As illustrated in Fig. 9, this method moves controllable loads from periods of high demand to periods of low production and cost, which take place between roughly 4 p.m. to 8 p.m. As a result, the overall operating cost minimized to $61.02 by GOA, $61.89 by DOA, $62.61 by HHO, and $63.09 by PSO. As seen in Table 3, implementing DSM minimizes peak load and increases the load factor. The day-ahead optimal setpoints of NG1 sources generated by GOA, DOA, HHO, and PSO are illustrated in Fig. 10. The optimal stacking of power production and SOC based on GOA for NG1 are shown in Fig. 11. At 2 a.m., the load at NG1 (8.08 kW) is optimally supplied by different sources. The battery takes 2.14, 2.06, 0.36, and 2.23 kW (charging mode), while the diesel generator produces 1.00, 1.14, 1.11, and 1.70 kW, and the grid supplies 9.22, 9.03, 7.35, and 8.63 kW under the GOA, DOA, HHO, and PSO algorithms, and the PV produces 0 kW, respectively. Similarly, at 8 p.m., the load at NG1 (13.66 kW) is met by 5.74, 3.75, 1.28, and 5.89 kW from the battery (discharging mode), 7.01, 7.24, 5.36, and 6.99 kW from the diesel generator, and 0.92, 2.67, 7.03, and 0.78 kW from the grid for GOA, DOA, HHO, and PSO, respectively, and 0 kW from the PV, as demonstrated in Figs. 10 and 11.
Fig. 9
Daily load curve for NGs.
Table 3 The summary of the daily load curves before and subsequent DSM.Fig. 10
Power components and SOC for the NG1 during scenario I with DSM.
Fig. 11
Stacking of power production and SOC based on GOA for NG1, scenario I with DSM.
For NG2, the overall operating cost per day determined by GOA, is roughly $78.14, but DOA reports $78.99, HHO indicates $79.44, and PSO shows $79.67 without using DSM, and with applying DSM technique, as indicated in Fig. 9. Consequently, the operating cost per day is decreased to $74.60 by GOA, $75.41 by DOA, $75.94 by HHO, and $76.16 by PSO. The day-ahead optimal setpoints of NG2 sources investigated by GOA, DOA, HHO, and PSO are depicted in Fig. 12. The optimal stacking of power production and SOC based on GOA for NG2 are observed in Fig. 13. At 3 a.m., the load at NG2 (9.20 kW) is optimally supplied by various sources. The battery stores 2.41, 2.37, 0.47, and 2.85 kW, while the diesel generator produces 1.00, 1.17, 1.30, and 2.4 kW, and the grid provides 9.84, 9.63, 7.82, and 8.88 kW under the GOA, DOA, HHO, and PSO algorithms, respectively, and the WT produces 0.78 kW. Also, at 2 p.m., the load at NG2 (16.73 kW) is satisfied by 0, 0, 0.36, and 0 kW from the battery, 3.96, 3.73, 2.61, and 4.18 kW from the diesel generator, and 10.61, 10.71, 11.75, and 10.54 kW from the grid for GOA, DOA, HHO, and PSO, respectively, and 2.1 kW from the WT, as displayed in Figs. 12 and 13.
Fig. 12
Power components and SOC for the NG2, scenario I with DSM.
Fig. 13
Stacking of power production and SOC based on GOA for NG2, scenario I with DSM.
A sensitivity analysis was performed on the population size and maximum iterations. Multiple simulations were conducted, varying the population size from 60 to 140 and iterations from 2000 to 6000. As illustrated in Table 4, the results show that a population size of 120 and 5000 iterations yield the most stable and optimal solution. A thorough comparison with alternative algorithms was carried out to confirm the efficacy and resilience of the suggested GOA-based EMS, as shown in Tables 5, 6, 7, and 8. Indicators of statistics (mean, best, worst, and standard deviation) were used to conduct the evaluation over several independent runs. Additionally, the computational time analysis and the importance of the performance variations statistically was evaluated using the Wilcoxon signed-rank test.
Table 4 Sensitivity analysis of GOA hyperparameters.Table 5 Statistical outcomes over ten runs for NG1 and NG2 without DSM.Table 6 Statistical outcomes over ten runs for NG1 and NG2 with DSM.Table 7 Computational time analysis.Table 8 Wilcoxon test over ten runs for NG1 and NG2.
(b)
Scenario II: operation of a grid-tied multi-NGs cluster
This case study assesses the performance of four NGs operating in grid-connected mode as a single microgrid in a cluster. Figure 14 illustrates the daily profile load, with peak demand of 68.38 kW at 7 a.m. and off-peak demand of 32.83 kW at 10 a.m., when implementing the DSM technique. GOA produces a daily operational cost of about $268.35 for MNGs, while DOA, HHO, and PSO report costs of $269.37, $273.90, and $275.32 with DSM, respectively. The day-ahead optimal setpoints of MNGs sources evaluated by GOA, DOA, HHO, and PSO are depicted in Fig. 15. The optimum stacking of power production and SOC based on GOA for MNGs are given in Fig. 16. At 7 a.m., the load at MNGs (68.38 kW) is optimally supplied by different sources. The battery gives 0, 1.11, 0.97, and 0 kW, while the diesel generator provides 13.15, 13.54, 9.5, and 11.42 kW, and the grid transfers 51.95, 50.85, 54.60, and 54.07 kW under the GOA, DOA, and PSO algorithms, and the PV and WT produce 1.10 and 1.78 kW, respectively. Additionally, at 5 p.m., the load at MNGs (50.53 kW), the battery absorbs 3.12, 2.12, 1.55, and 1.22 kW (charging mode), 18.63, 19.88, 12.14, and 21.42 kW from the diesel generator, and 26.00, 25.76, 34.07, and 25.12 kW from the grid for GOA, DOA, HHO, and PSO, respectively, and 0.96 kW, 1.81 kW from PV and WT, as investigated in Figs. 15 and 16.
Fig. 14
Daily load curve for MNGs.
Fig. 15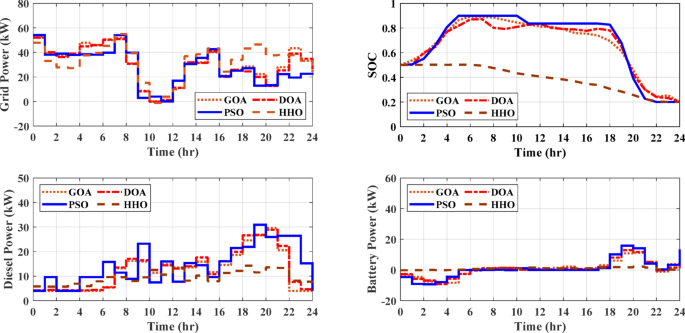
Power components and SOC for the MNGs, scenario II with DSM.
Fig. 16
Stacking of power production and SOC based on GOA for MNGs, scenario II with DSM.
The day-ahead energy consumption cost reduces by about $23.85 with GOA, $22.83 with DOA, $18.30 with HHO, and $16.88 with PSO, compared to the base scenario 1 without DSM. With a percentage of cost savings of around 8.16%, the GOA algorithm outperforms the DOA, HHO, and PSO algorithms in achieving optimal setpoints for the battery and the diesel generator using the DSM strategy while taking daily operating costs into consideration.
Real‑time scheduling (level II) results
Forecasting weather, electricity prices, and load demand always involves some degree of uncertainty. To effectively handle these uncertainties, a real-time EMS based on MPC is implemented, it uses day-ahead scheduling to continuously update and reschedule distributed energy resources’ operating setpoints., ensuring robust and cost-effective system operation. The controller continuously updates system states and forecasts, then determines optimal power dispatch for battery storage systems, diesel generators, and grid interaction within a moving prediction horizon. The objective function incorporates operational cost minimization, and grid power exchange penalties, while explicitly enforcing technical constraints such as SOC bounds, generator capacity limits, and power balance equations. In this study, real-time data is compared with projected data from scenario II, which was obtained through GOA. To maintain effective coordination between layers, the day-ahead GOA schedule serves as a reference trajectory rather than a rigid constraint for the real-time MPC layer. During real-time operation, the MPC updates control actions using updated short-term forecasts and actual system measurements. When significant deviations occur due to severe forecast errors or unforeseen disturbances, the MPC adjusts the operating strategy to prioritize real-time feasibility and cost-effectiveness over tracking the original day-ahead plan. The framework addresses communication and data latency; If the 15-min rescheduling time is far longer than the average communication delays in contemporary wiring or wireless intelligent grid systems, which vary from milliseconds to a few seconds. The actual solar irradiation, wind speed, load demand, and utility pricing statistics are displayed in Fig. 17. At 12 p.m., the load at MNGs (46.71 kW) is provided by 1.38 kW from the battery (20% SOC), 17.30 kW from the diesel generator, 3.21 kW from the grid, and 20.65 kW and 4.16 kW from PV and WT, as seen in Fig. 18. The cumulative cost for the MNGs using MPC for this study and the published study40, is depicted in Figs. 19 and 20.
Fig. 17
Actual grid price, solar irradiance, wind speed, and load demand data.
Fig. 18
Power components and SOC for the MNGs using MPC.
Fig. 19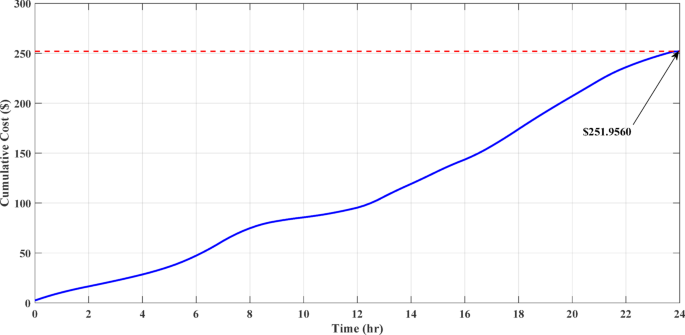
Cumulative cost for the MNGs using MPC.
Fig. 20
Cumulative cost for the MNGs using MPC compared to published study40.
Forecasting accuracy has a direct impact on the day-ahead scheduling decisions since the optimization relies on the forecasted photovoltaic generation, wind power, load demand, and electricity prices generated by the ANN model. To address this concern, a sensitivity analysis has been added by introducing ± 10% forecasting errors in renewable generation, load demand, and electricity prices. The analysis evaluates the impact of these forecasting errors on the total operating cost as well as the battery charging/discharging schedule and diesel generator dispatch, as shown in Table 9, the results demonstrate that forecasting errors increase the operating cost and lead to modifications in the battery and diesel schedules. However, the proposed MPC-based real-time energy management framework effectively mitigates these impacts by continuously updating the optimization using real-time measurements and rolling forecasts, thereby maintaining reliable and economical operation despite prediction inaccuracies.
Table 9 Sensitivity analysis of the proposed EMS under different forecasting error scenarios.
Based on simulation results, Table 10 will examine the daily operational cost summary. The real-time EMS results in daily savings of $16.39, reducing operating costs by about 6.11% from $268.35 to $251.96.
Table 10 The operating costs based on the day-ahead and real-time scheduling.